
Powerful Analytics
PATS works the way clinicians think. Axis clinical data management solutions include a default menu with 35 powerful analytical tools and an unlimited number of easily-customized reports. Healthcare professionals can quickly and easily generate monthly reports and sophisticated analysis—no IT expertise needed.
 |
PATS fosters exceptional reporting and analysis for clinical procedures, their efficacy, and long-term success. PATS analytics—including real-time dashboards—are ideal for clinical quality improvement, outcomes research, quality data management, and decision support. PATS’ built-in data mining and analytics tools make outcomes reporting a snap.
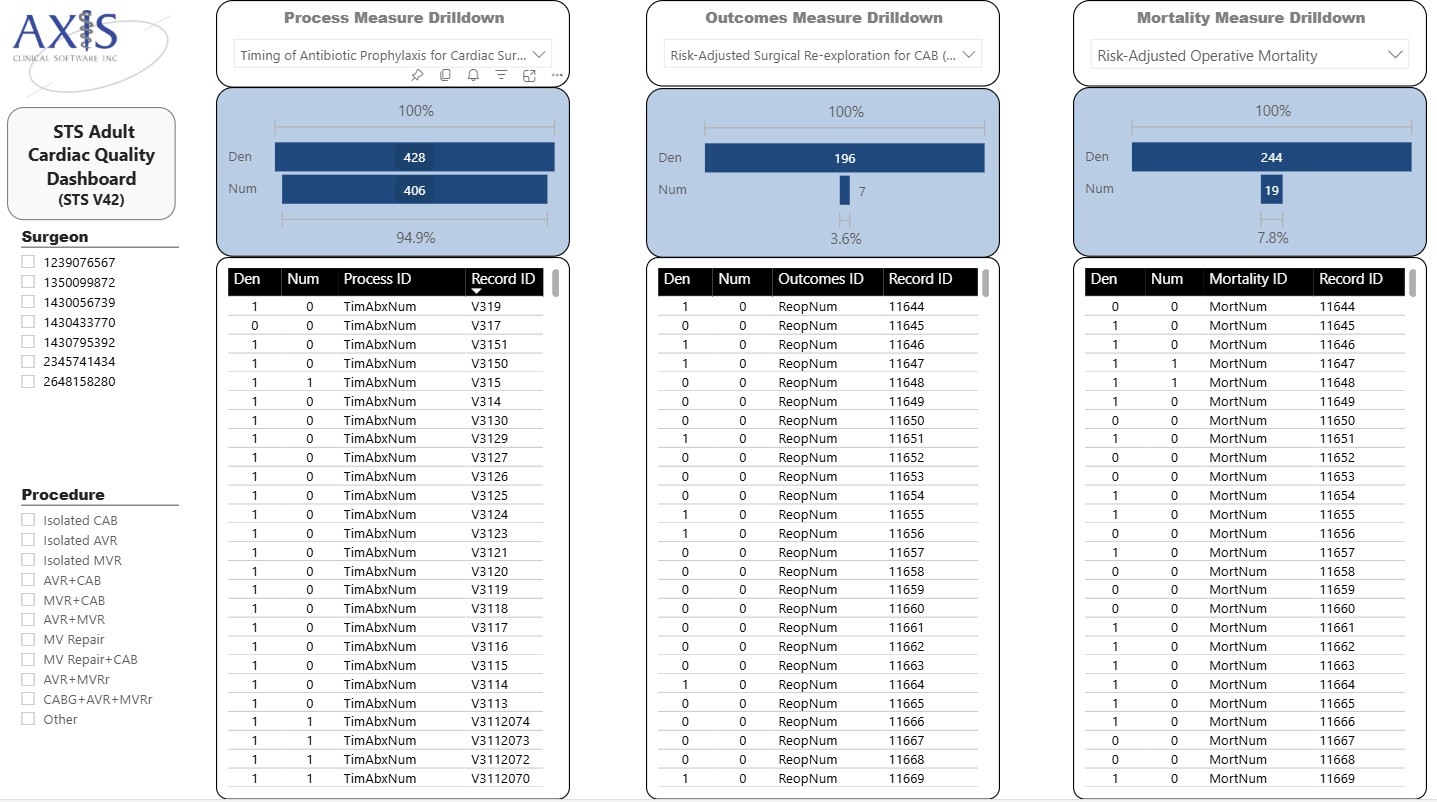
PATS' powerful, built-in reporting and analytics tools help you become an expert at managing clinical data. It’s a snap to convert PATS report data to sharp-looking charts and graphs. You can easily export your PATS data to third-party applications (Excel, PowerBi, for examples). You can easily drill down to the data you want and need. You don't need a technical background to succeed in clinical data management. With PATS, you get deep, complete data you can always trust.
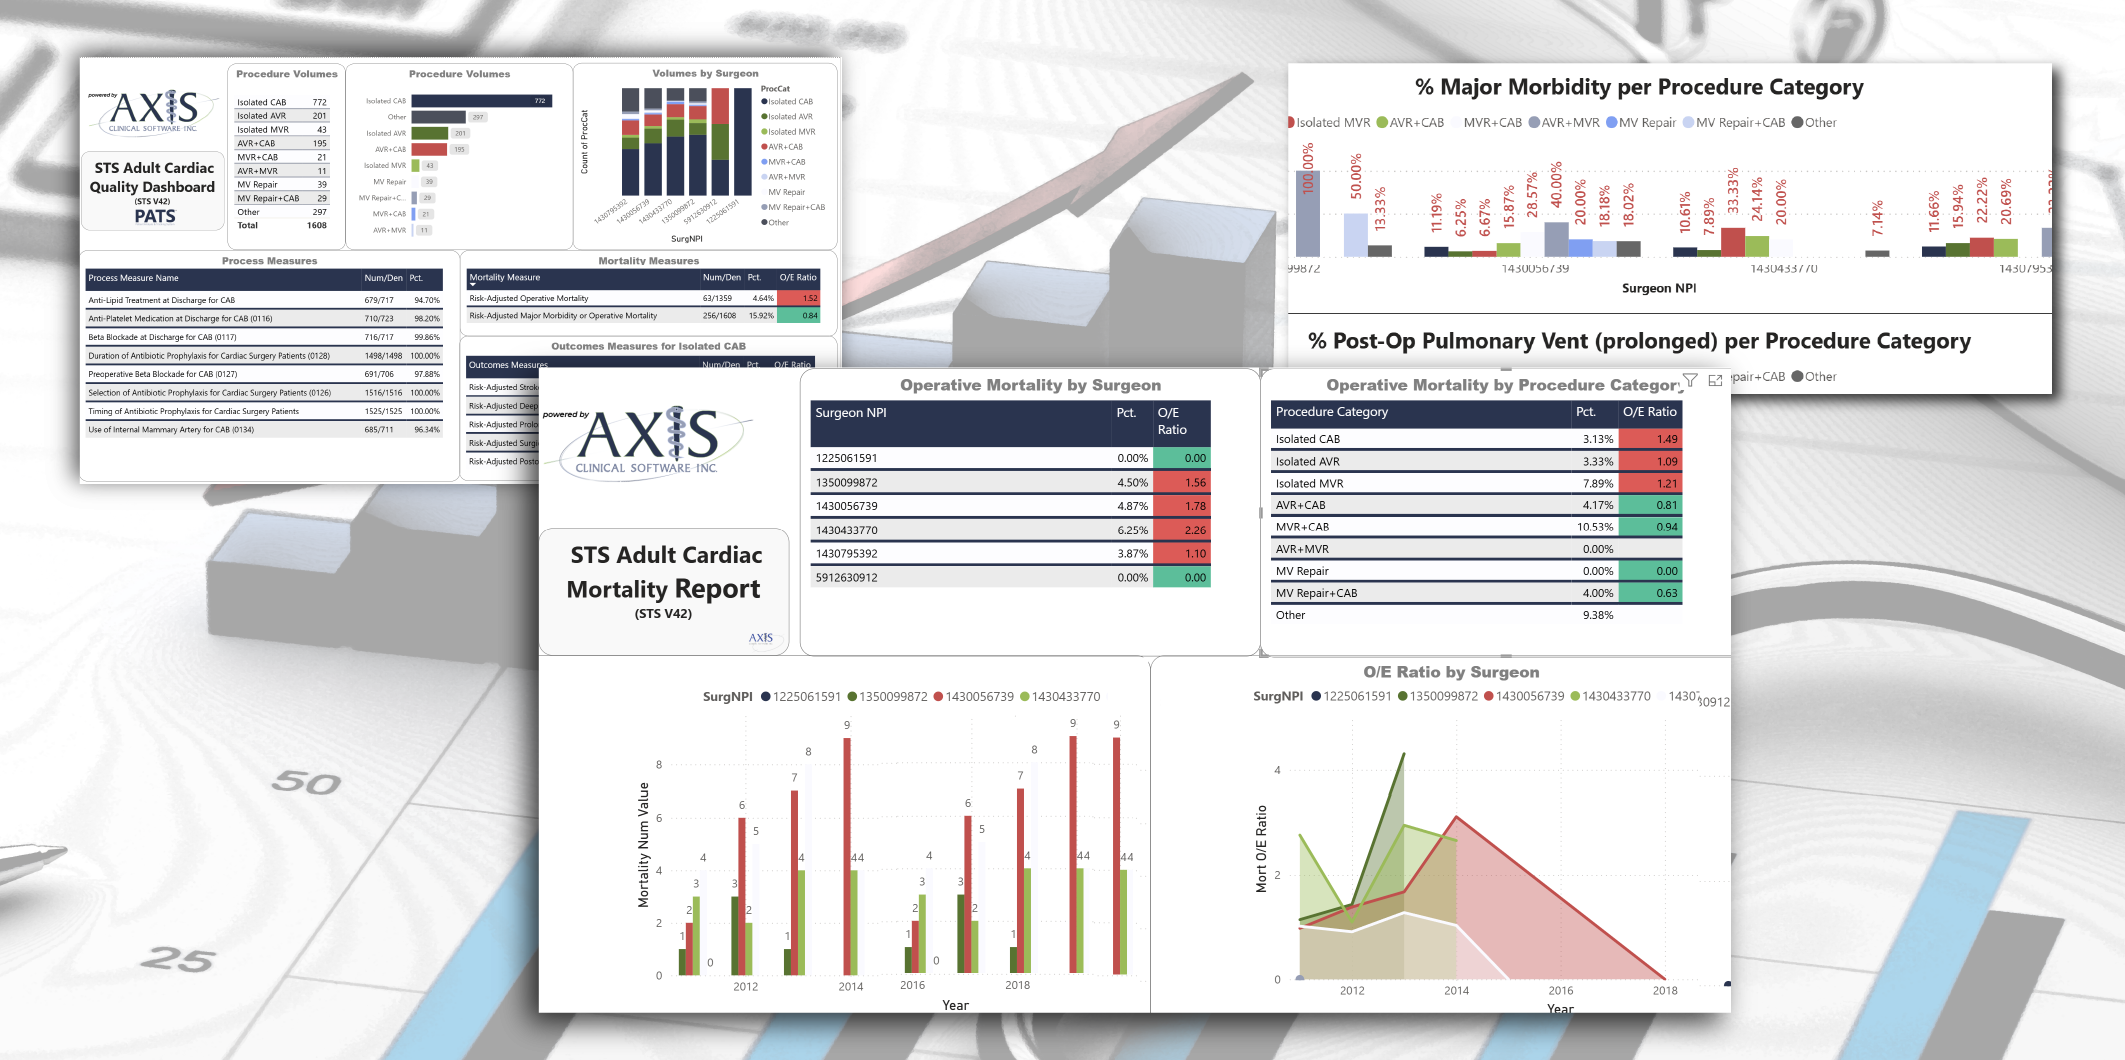
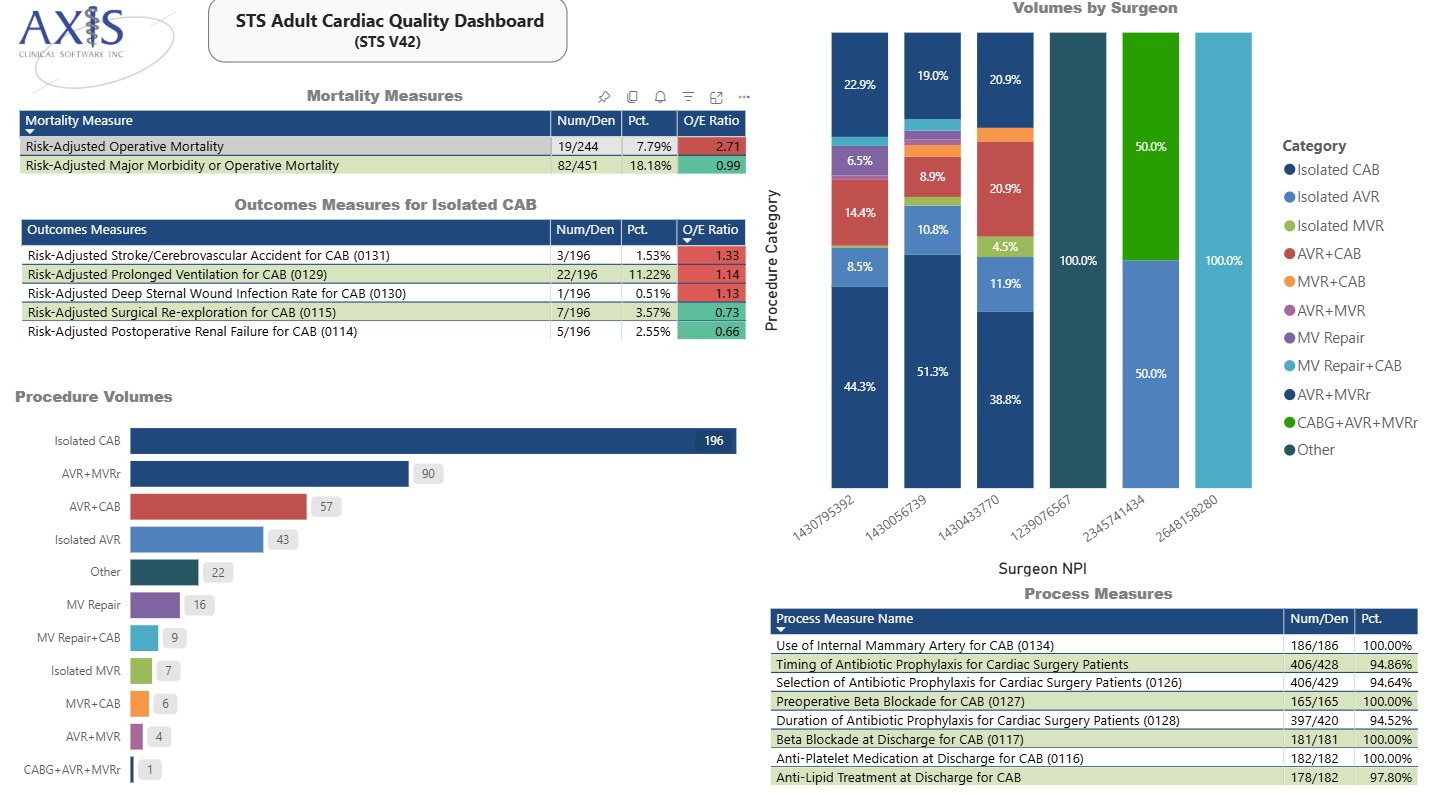
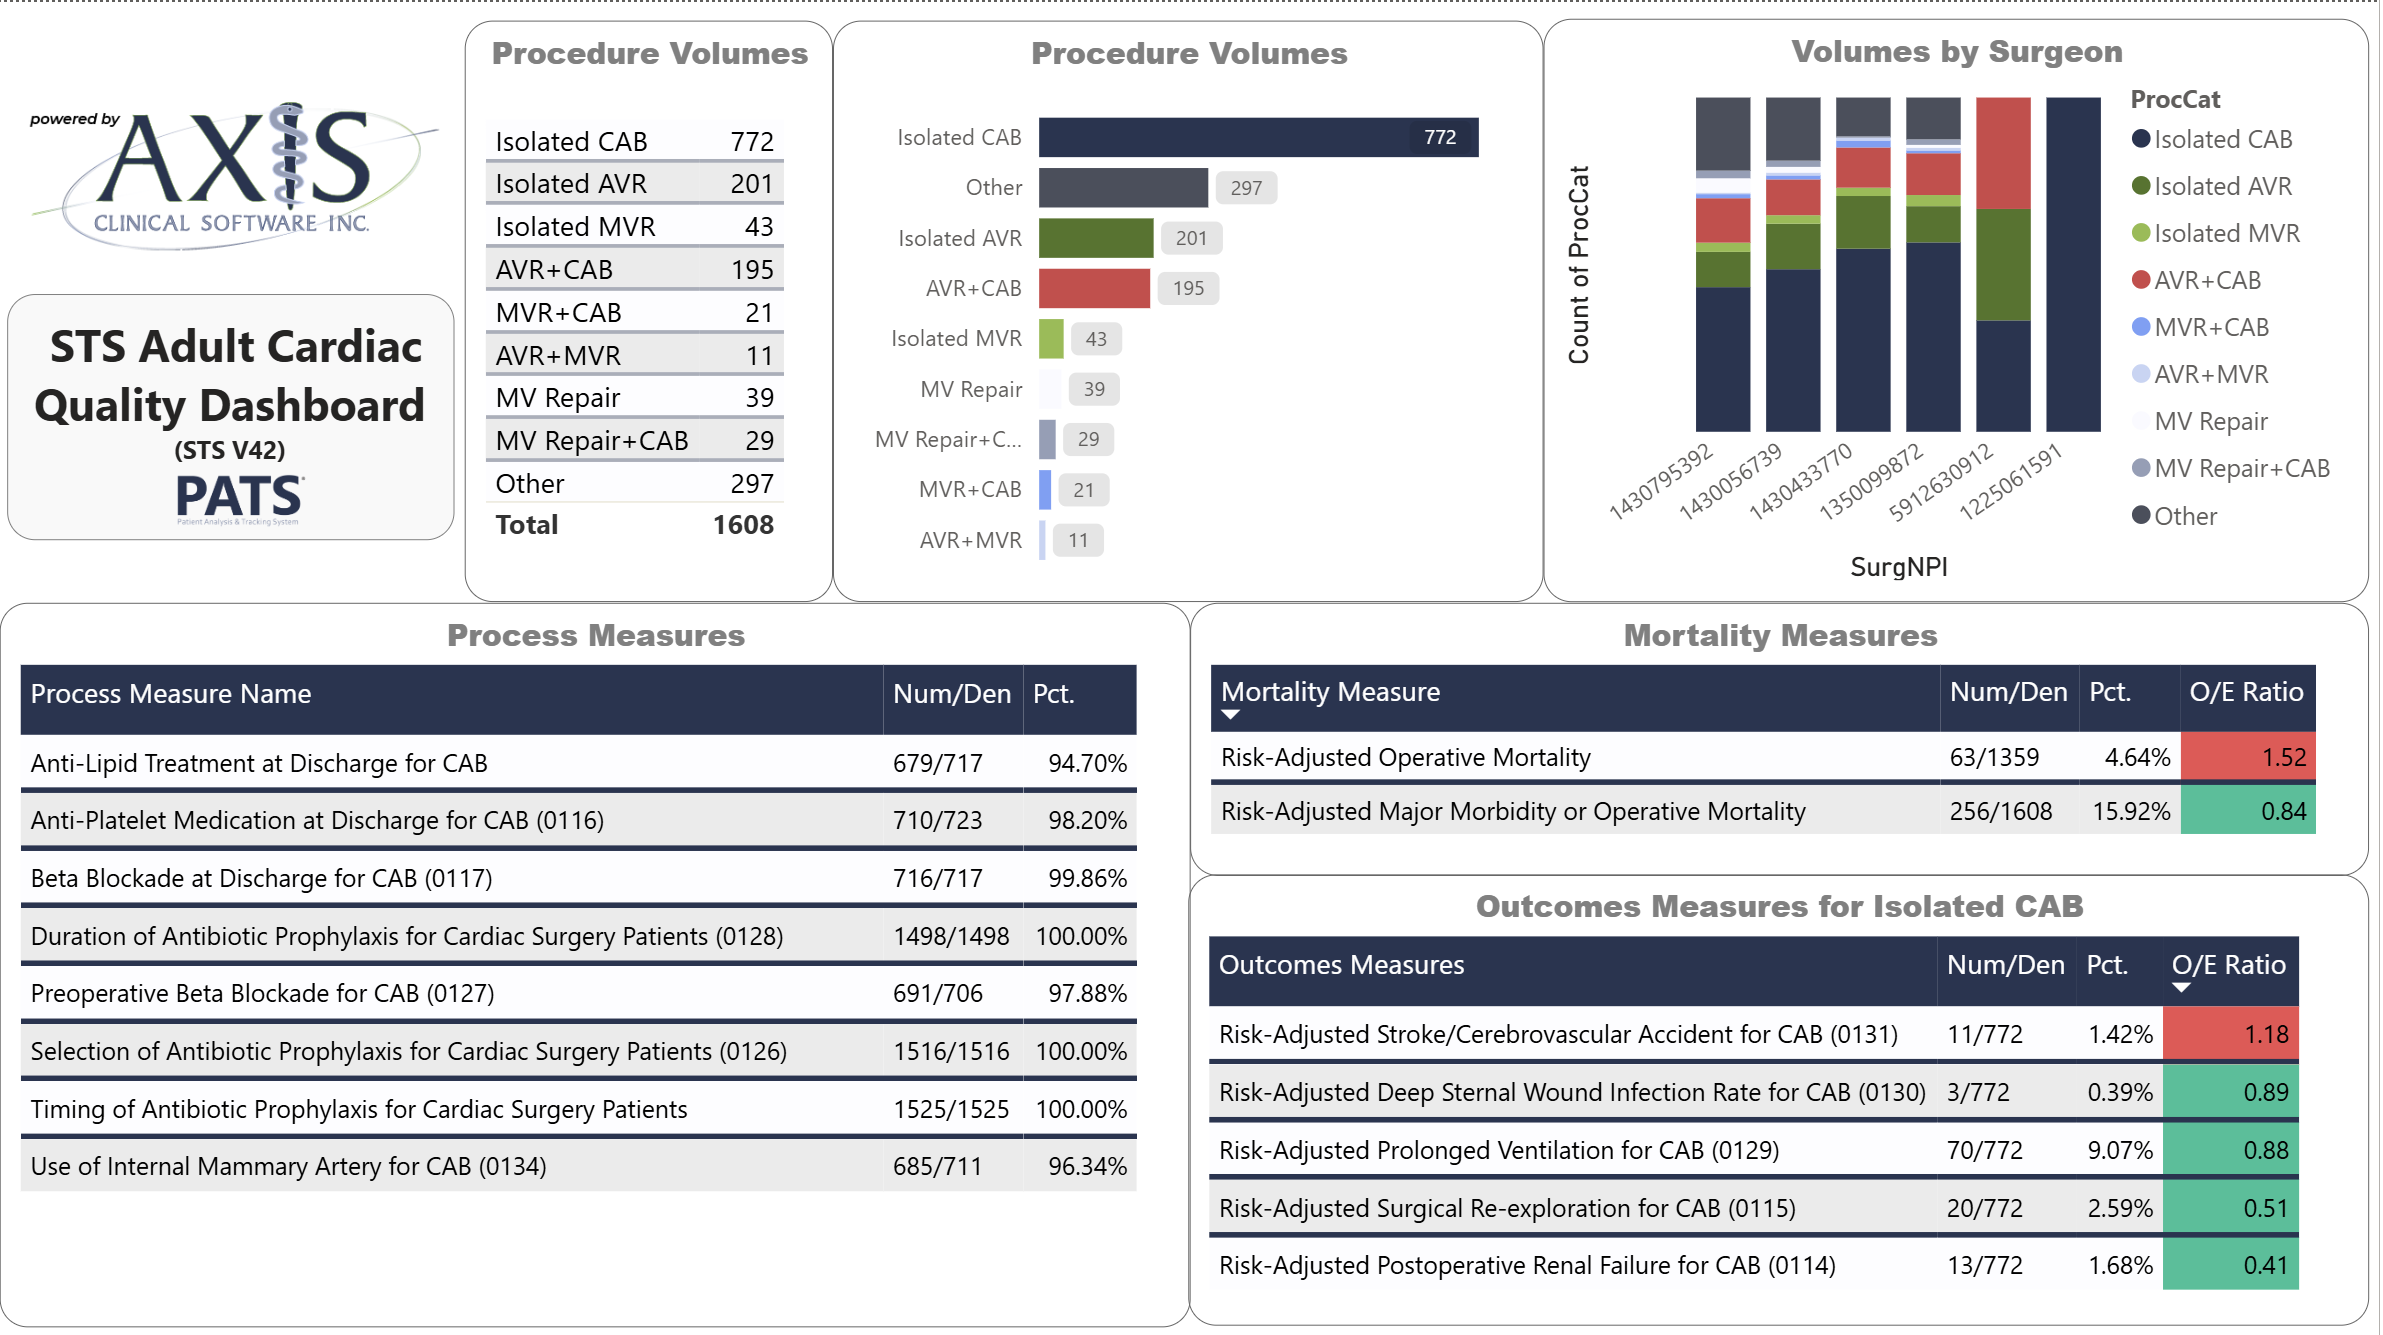
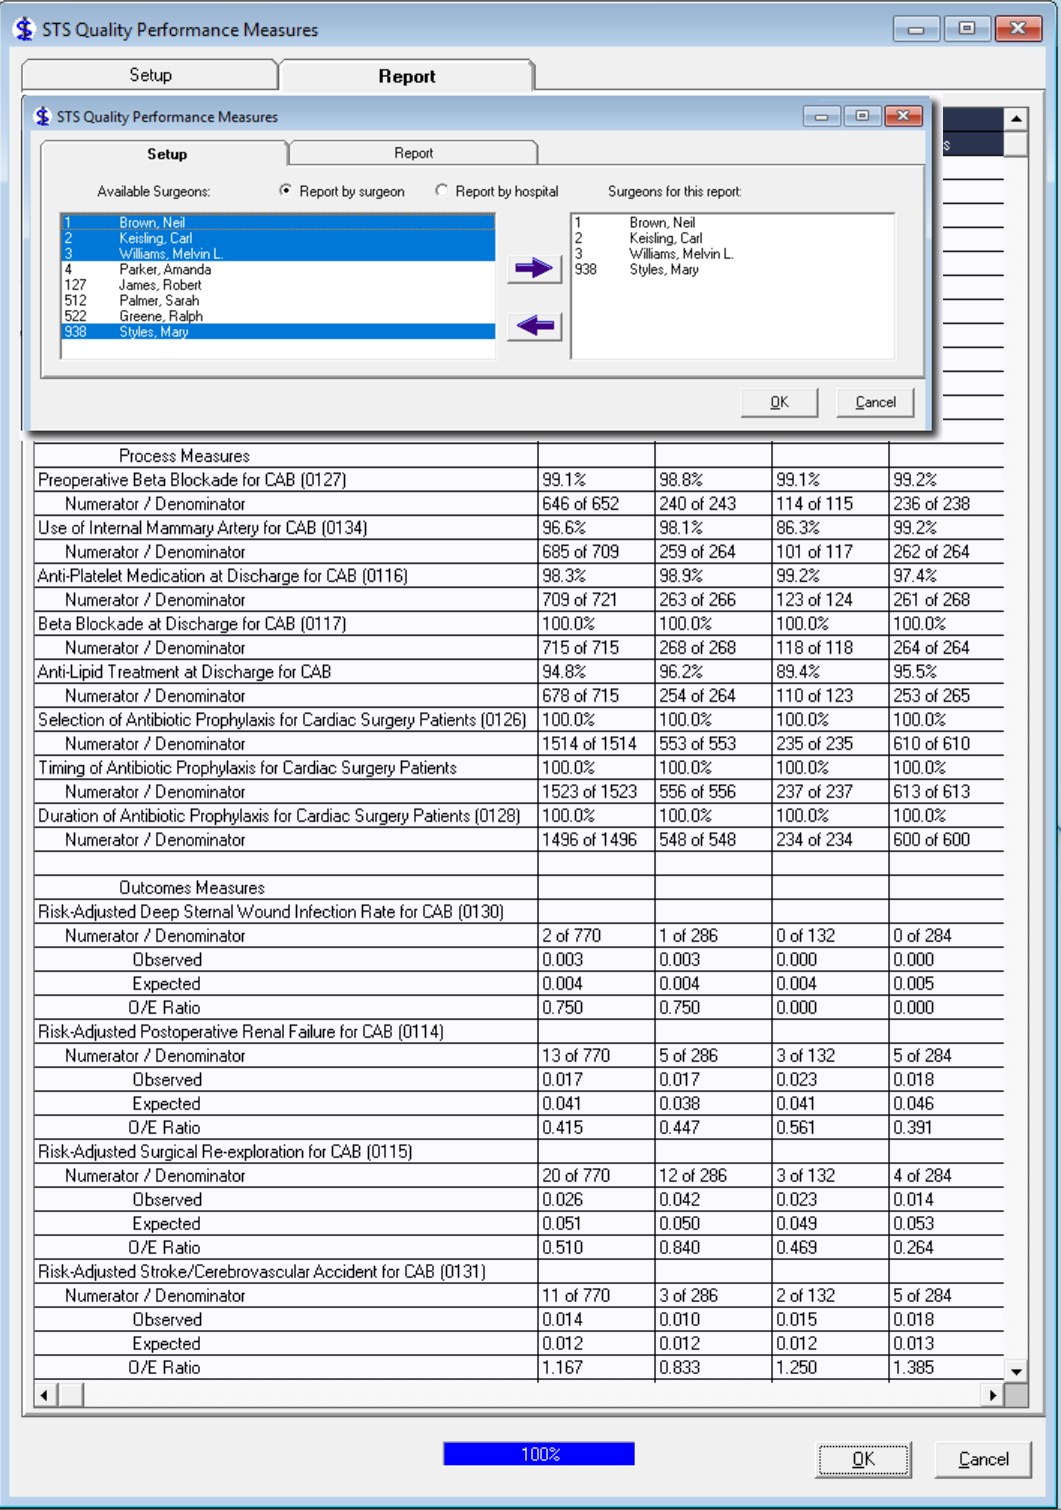
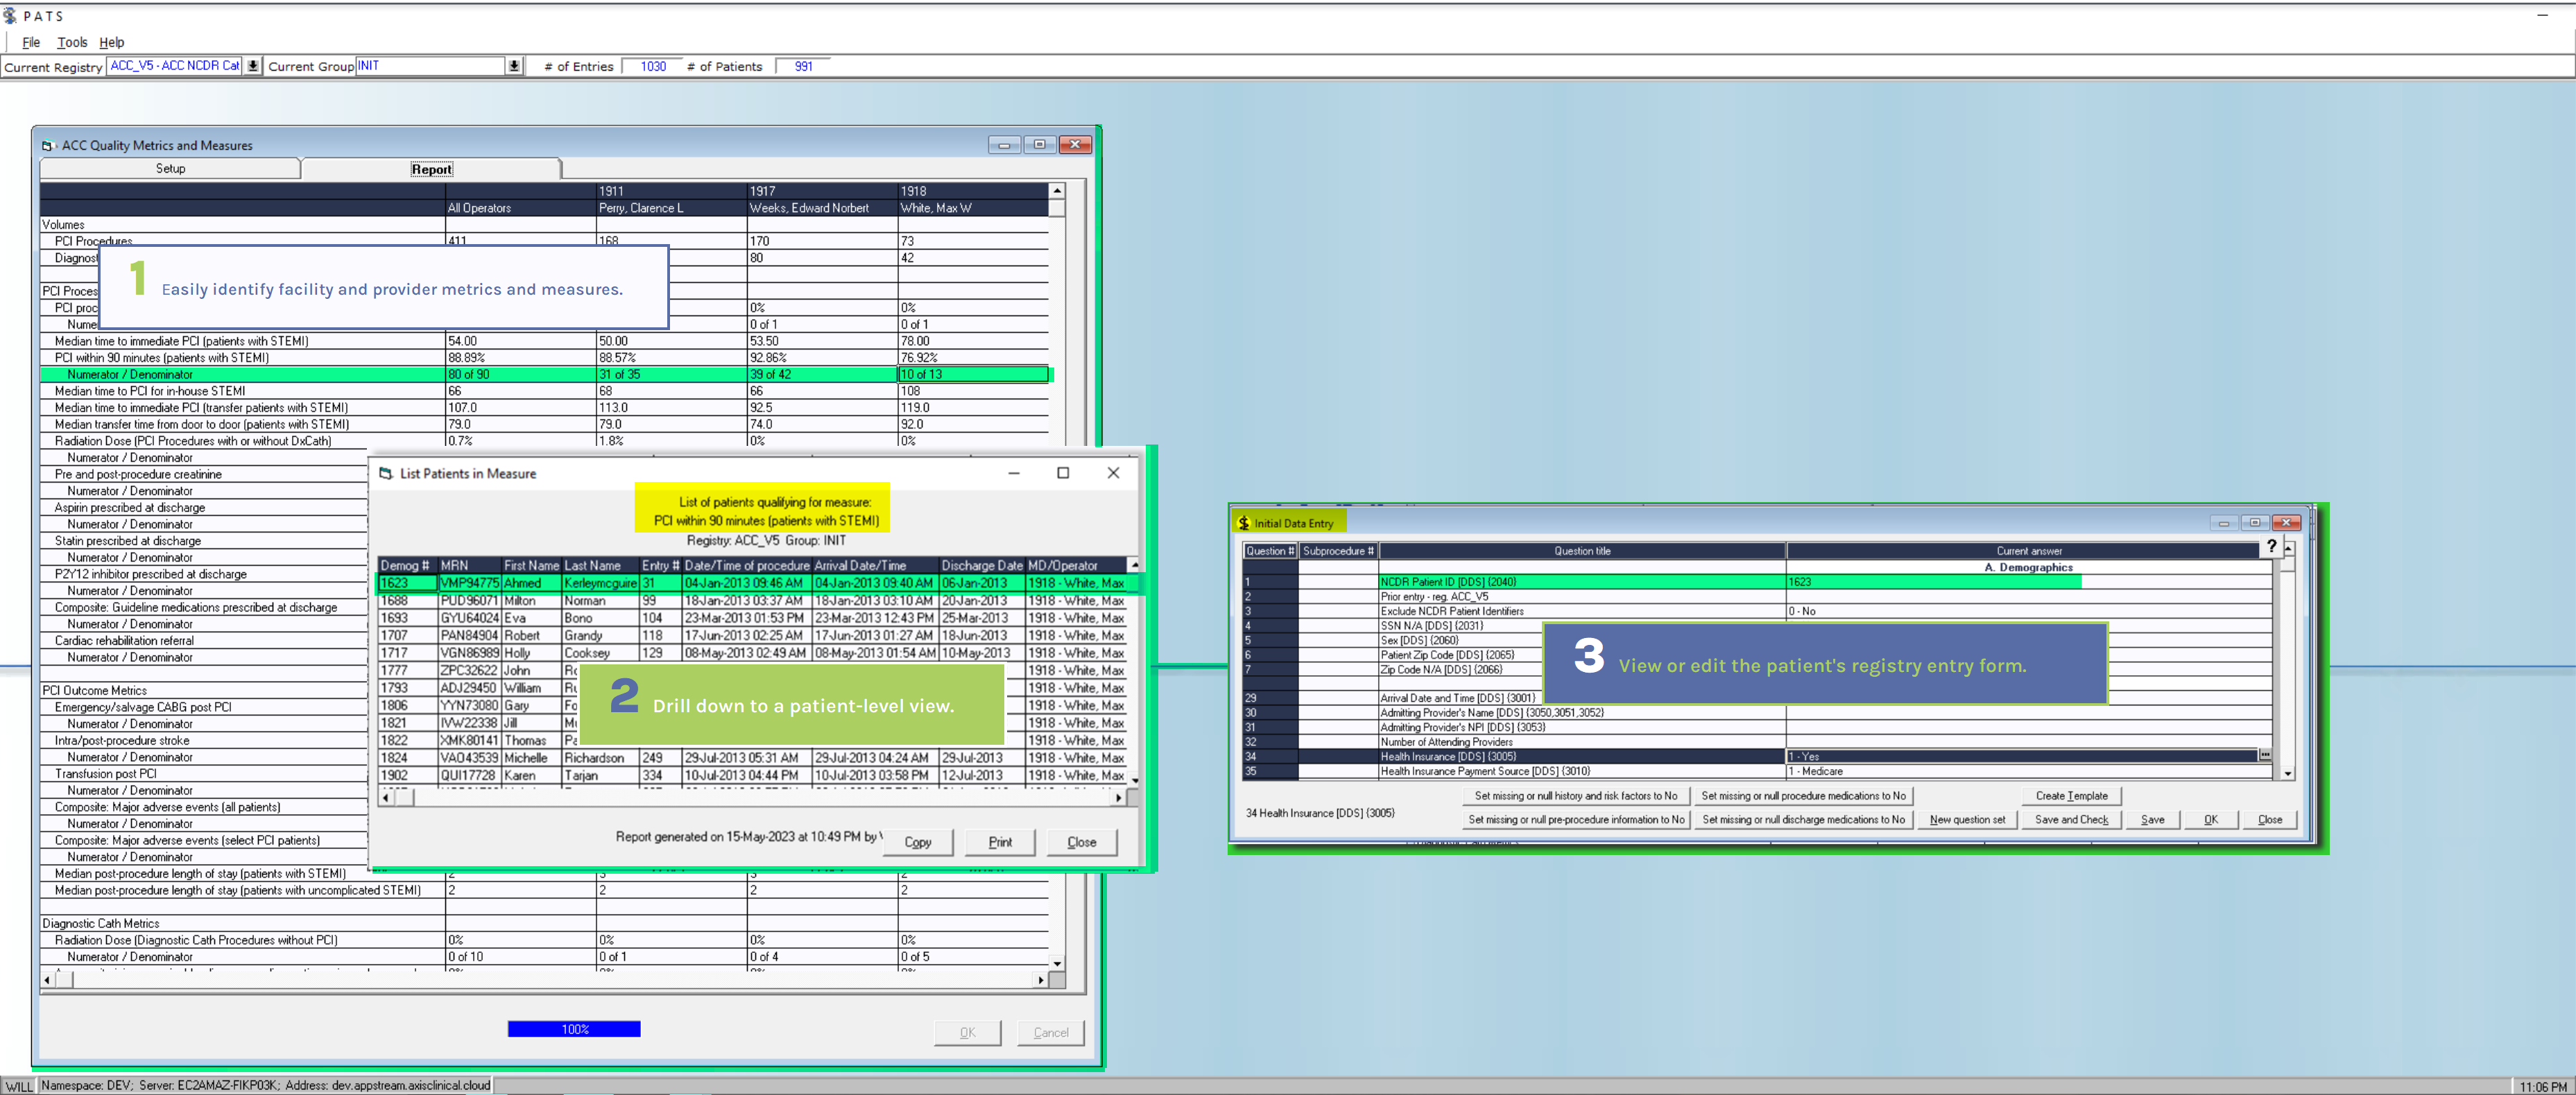
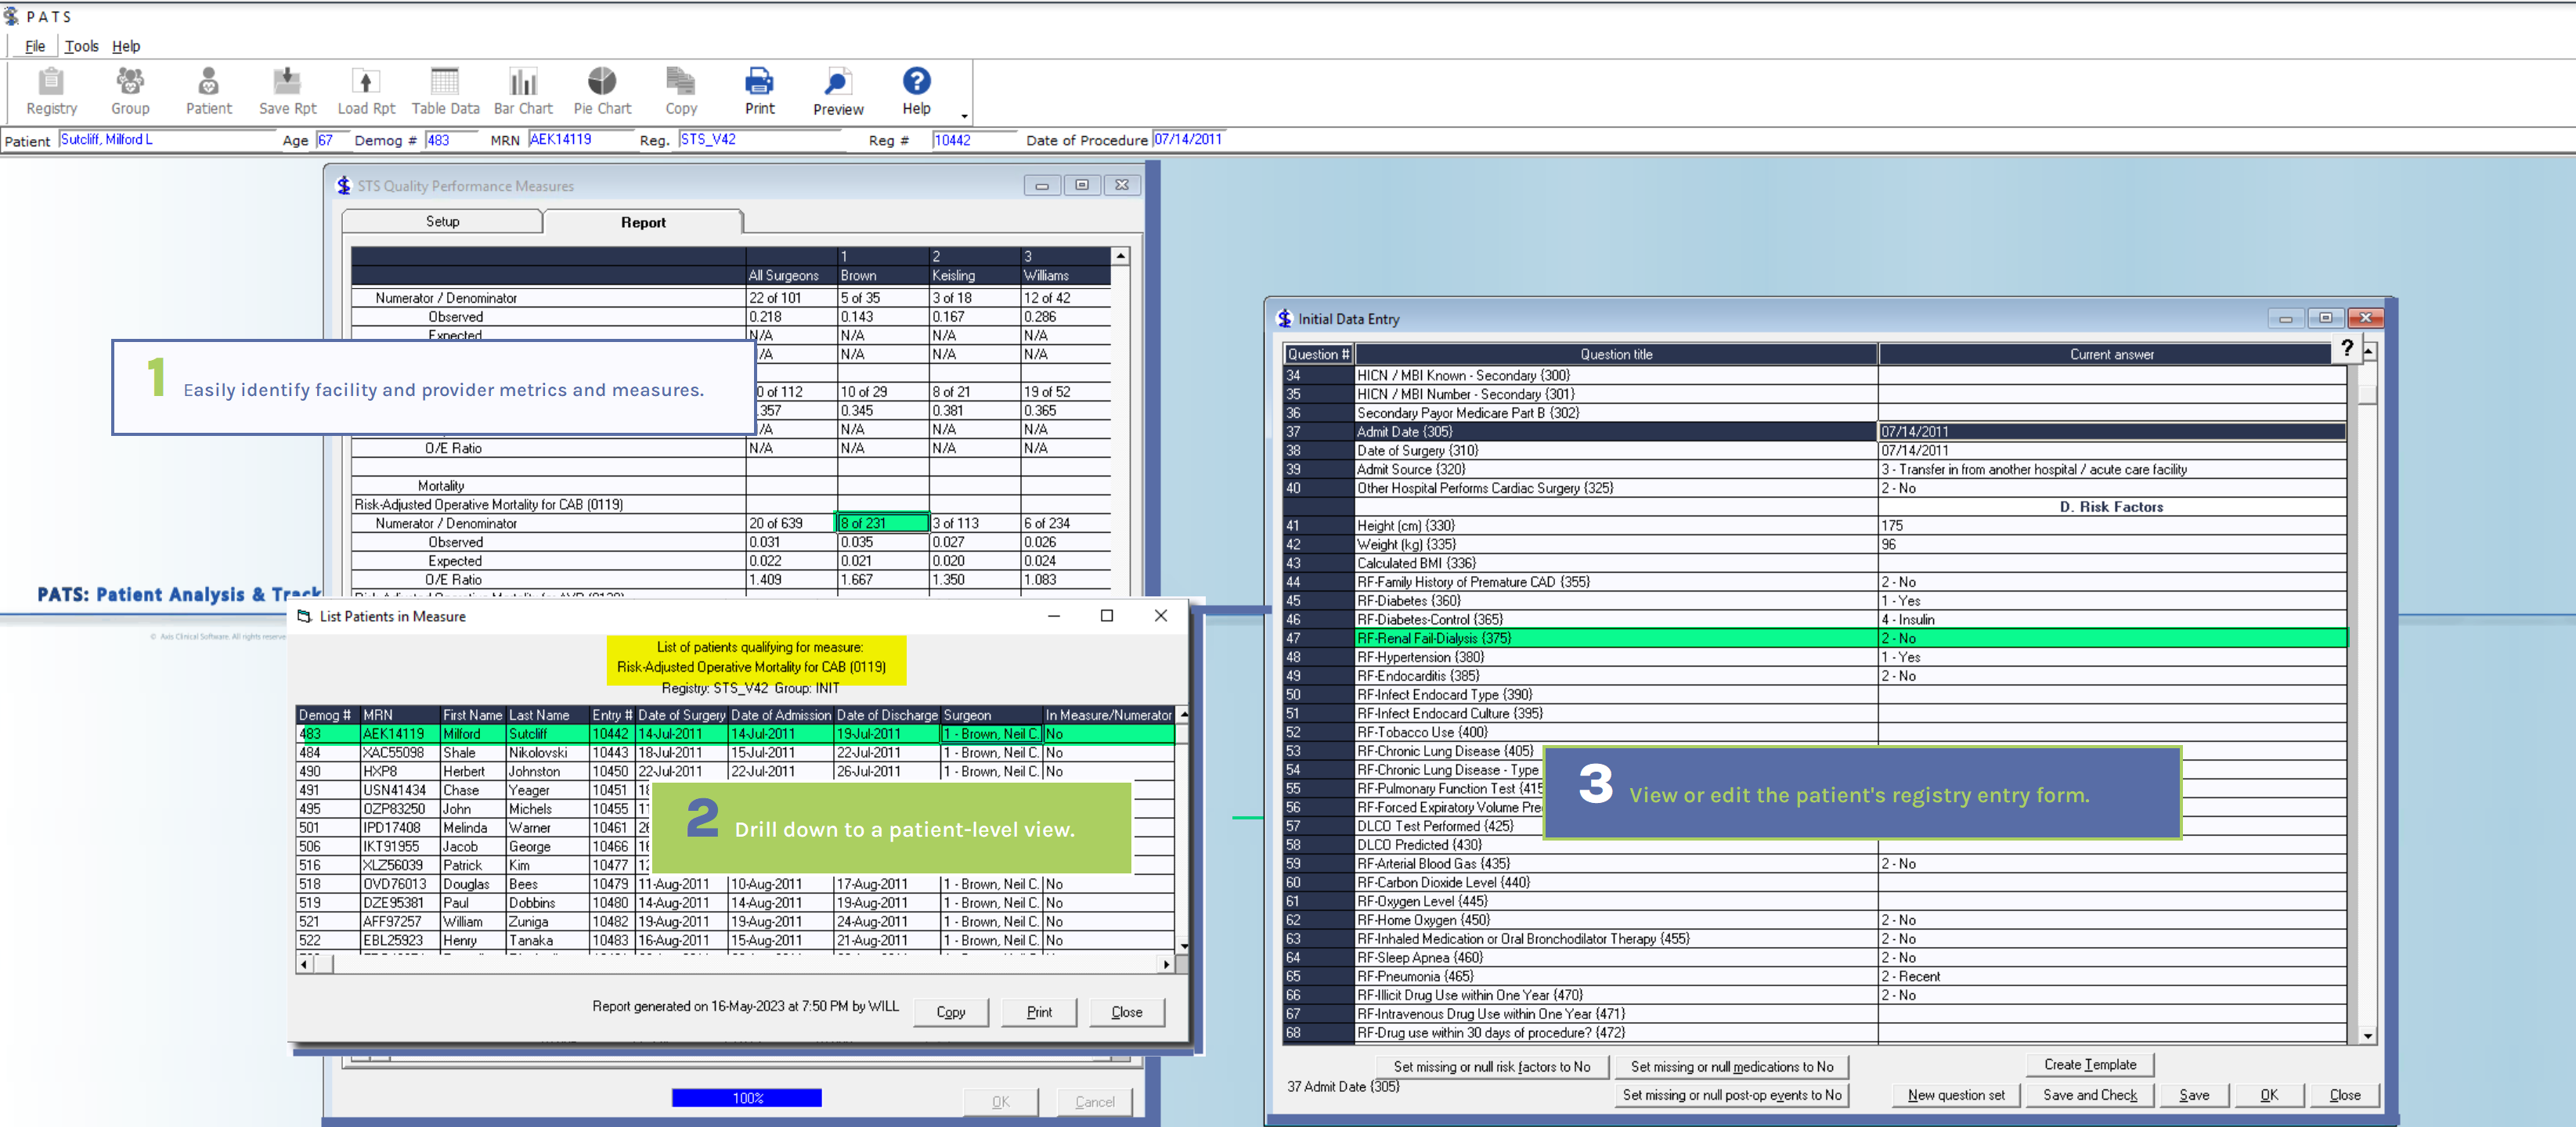
You understand the importance of real-time business intelligence trends and outcomes. With easy-to-use benchmarking reports, PATS helps you monitor trends and quality so national performance reports present no surprises. PATS includes interactive reports to track STS or ACC quality measures/metrics for any patient population—overall, by surgeon/operator, or by facility.
Quality reports are simple to run, with measure and drill-down to help drive your quality and outcomes improvements. And you can use this information to distinguish your entire healthcare organization to attract patients, specialists, researchers, and the highest quality providers.
Sample Reports:
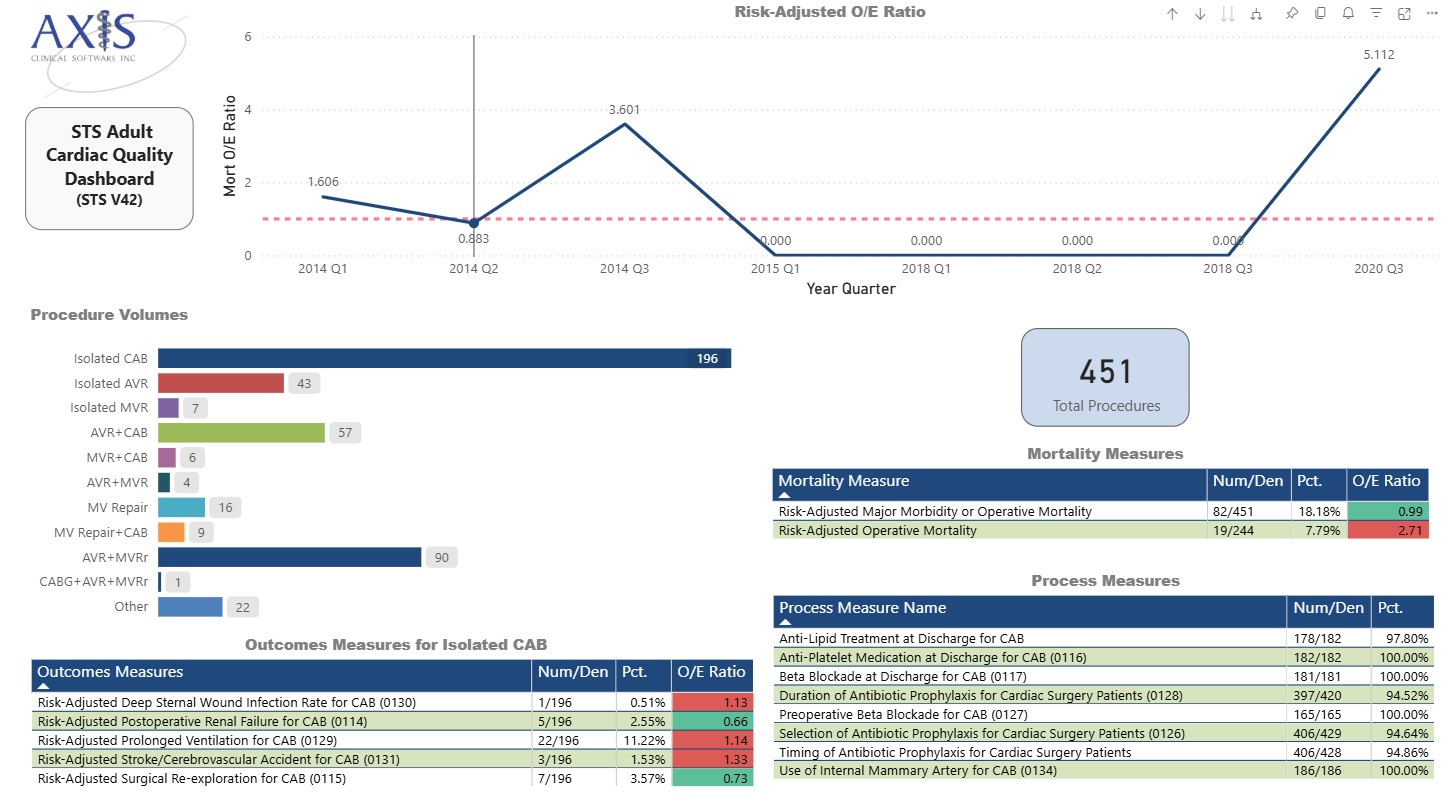
PATS quality reports include NCDR Hospital Registry and STS risk-adjustments and exclusions.
| |
|
|
Easily drill down to patient or entry level.
| |
Simple, seamless, on-demand ... and sharp-looking!
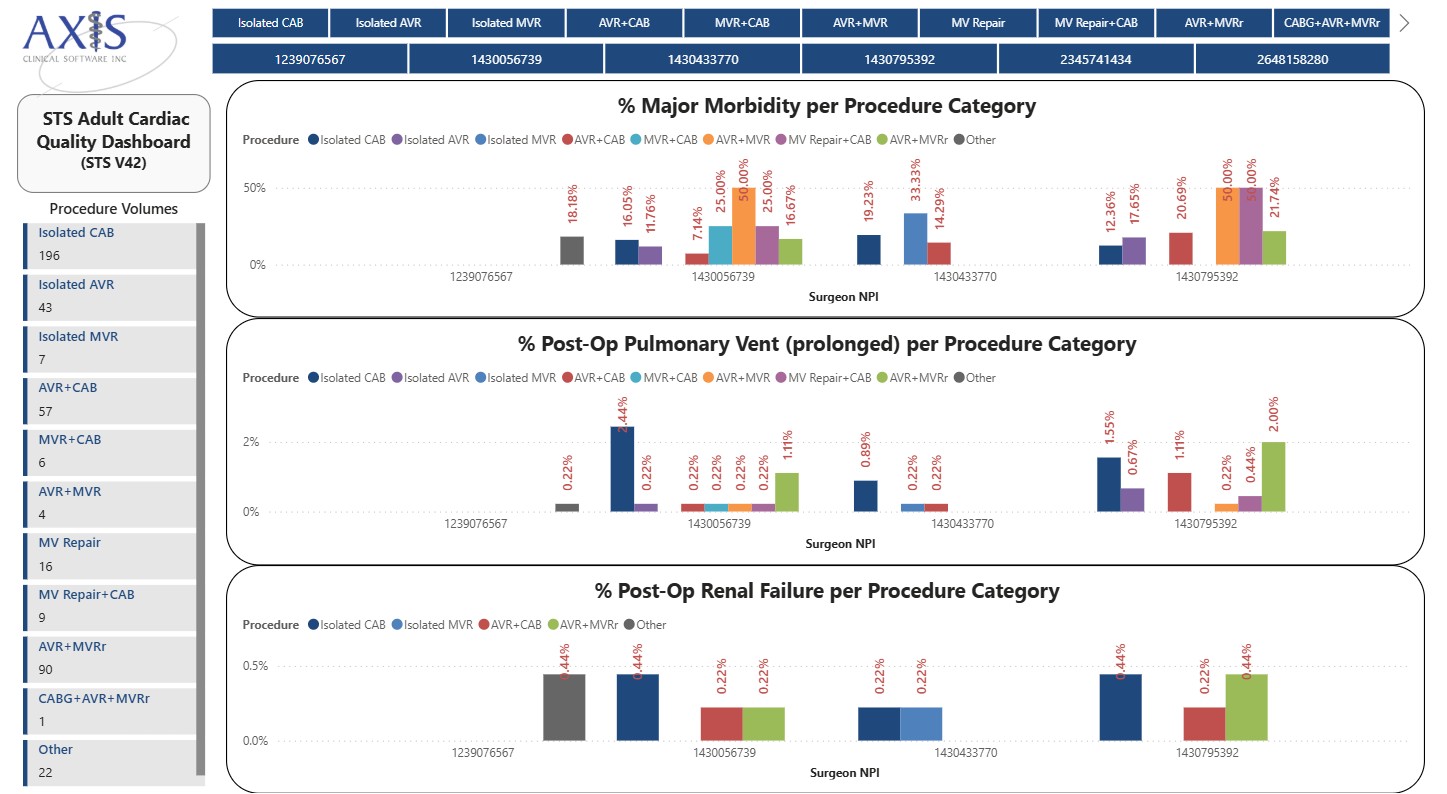
PATS Quality Dashboards transform your raw, STS and ACC data into meaningful, dazzling visualizations that bring your data to life. Using your latest data and real-time filtering, you can easily highight and showcase your data the way you want to.
 |
 |
 |
Dashboards are valuable tool to more quickly reveal patterns and at-a-glance visuals that help monitor your performance and quality programs. We provide and install all your dashboard templates for easy viewing in Microsoft BI (free version or paid). PATS Quality Dashboards are free, include installation and basic setup, and are lightly customized for your facilitiy's needs. Including:
- Hospital and surgeon performance
- Performance and quality trends
- Quality programs
Dashboard feartures
- Intuitive and interactive—easily read, understood
- Powered by PATS, with ACC and STS risk-adjustment, exclusions
- Quick, easy access with broad context Shareable (no PATS User ID needed for viewing)

PATS analytics make it easy for you to create and generate ad hoc reports. PATS crunches thousands of data points almost instantaneously. You can use any data field(s) to select custom patient population(s). You can easily convert tabular data values to sharp looking graphical formats, and you can export to any third-party presentation application (Excel, PowerPoint, etc.).
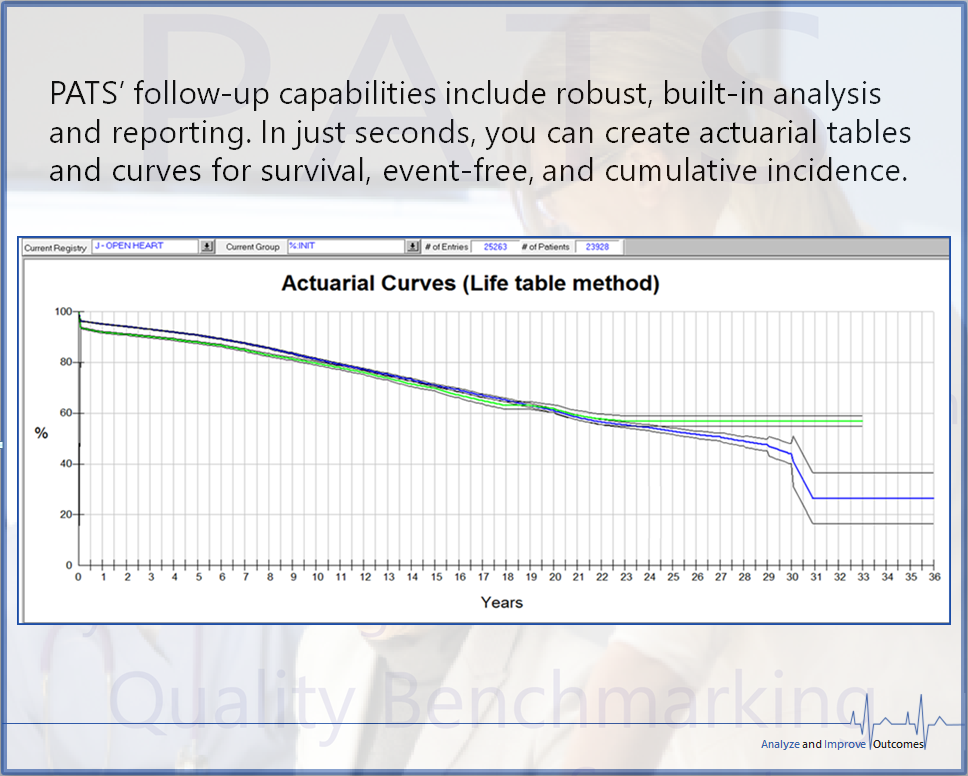
Use PATS' unique longitudinal tracking to create customized follow-up data-capture and reporting programs. You can identify short- and long-term trends for outcomes initiatives and to track quality measures at the hospital, physician or patient level. And you can distinguish your healthcare organization to patients, researchers, specialists, and the highest-quality providers.
Plus much more!
PATS analytics tools include:
|
|